Tracker
Track anything in your notes: habits, moods, weight, exercise: and visualize it with line charts, bar charts, and summaries. Collects data from tags, frontmatter, and text patterns.
pyrochlore is credited as the original plugin creator. Setup notes, fit assessments, and cautions below are Obsidian Mate editorial guidance. How we review resources
Overview
Track anything in your notes: habits, moods, weight, exercise: and visualize it with line charts, bar charts, and summaries. Collects data from tags, frontmatter, and text patterns. It helps aggregate repeated values from daily notes into summaries and trend views. The practical value is a repeatable workflow that remains visible in ordinary Markdown or Obsidian's own interface, rather than an isolated feature added without a plan.
How to Install Tracker
- 1Open Obsidian Settings, select Community plugins, and confirm Restricted mode is disabled.
- 2Search the community catalog for Tracker, install it, and enable it.
- 3Open the plugin settings and review its defaults before using it on existing notes.
- 4Test the workflow in a copied note or disposable vault, then inspect the resulting files.
How to Use Tracker
Track one consistently formatted field or tag across a small date range, verify every matched note, and only then add charts or broader date windows.
When Tracker Helps
It helps aggregate repeated values from daily notes into summaries and trend views.
A Safe First Workflow
Track one consistently formatted field or tag across a small date range, verify every matched note, and only then add charts or broader date windows.
Limits and Checks
- Inconsistent dates and field formats silently weaken results. A chart cannot correct gaps or changes in how the underlying habit was recorded.
- Keep a recoverable vault backup before enabling automation or bulk changes.
Details
- GitHub stars
- 2k+
Sources and Documentation
This guide was checked against the creator's repository and primary documentation.
Related Obsidian Plugins
Charts
Create interactive charts and graphs directly in your notes using simple code blocks. Bar, line, pie, radar, and more: powered by Chart.js and integrates with Dataview.
Heatmap Calendar
GitHub-style contribution heatmaps for your notes. Visualize habits, writing streaks, workouts, or any daily activity as a year-at-a-glance colored calendar powered by Dataview.
Graph Analysis
Advanced graph analysis tools for your vault. Discover note relationships with co-citations, link predictions, community detection, and centrality metrics.
Strange New Worlds
See how your notes are connected in real-time. Shows backlink and block reference counts inline, revealing hidden connections across your vault.
Related Guides
7 Obsidian Plugins by Workflow: What They Add and What to Check
A workflow-based guide to seven Obsidian plugins for sync, visualization, calendars, planning, and writing, with selection criteria, limitations, and safety checks.

Obsidian Properties: The Complete Guide
Master Obsidian Properties from zero to expert: YAML frontmatter, every property type, Bases, Dataview, templates, naming conventions, real-world examples, and performance tips for large vaults.
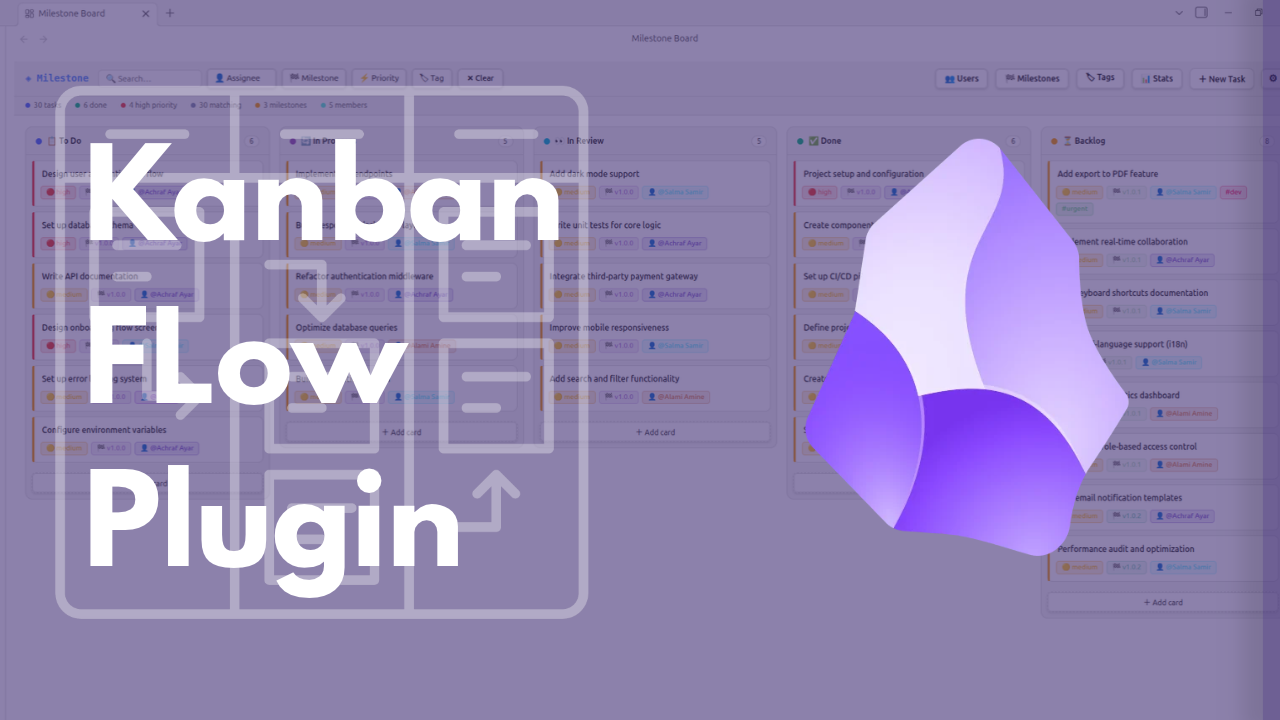
Kanban Flow for Obsidian: Setup, Boards, and Project Workflows
A practical guide to Kanban Flow for Obsidian: install the plugin, configure boards and milestones, manage task metadata, and understand its local JSON storage and sync limits.
Explore more Obsidian resources
Discover more plugins, themes, templates, and starter vaults to build your perfect Obsidian setup.